
By MERLION$ | Merlion Finance
📊 Quick Recap of the Day
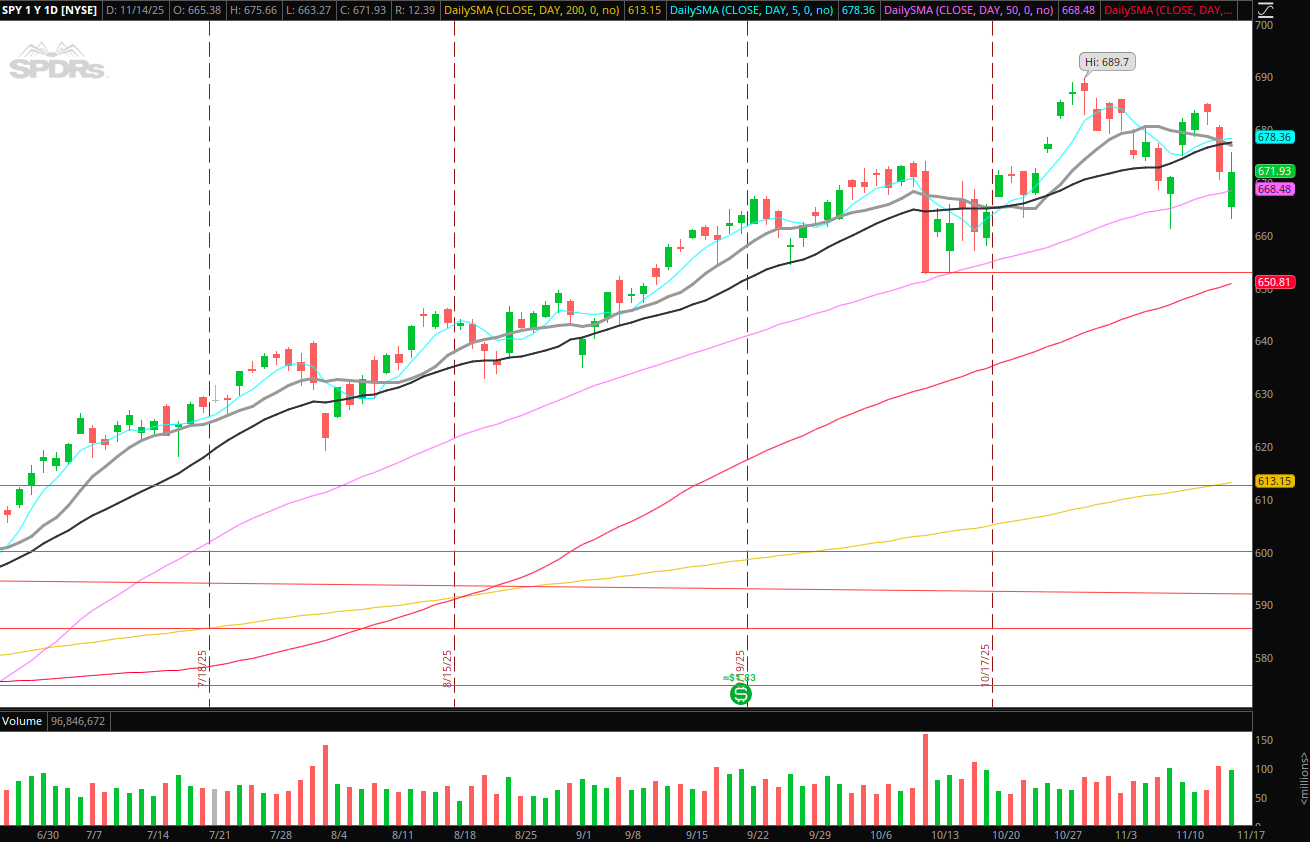
- Opening price: US $669.70. Investing.com+2StockAnalysis+2
- High of the day: ~US $673.71. StockAnalysis+1
- Low of the day: ~US $662.17 – ~US $662.26. Investing.com+1
- Close: US $665.67, down ~0.93%. Investing.com+1
- Volume: ~87.65 million shares. StockAnalysis
So yes – SPY tried to break higher, got a little pump, but ended the day down with a bit of a punch in the gut.
🧮 Technical Indicator Breakdown

✅ Support & Resistance
- Resistance up around US $673.70 (day high).
- Support tested around US $662–662.30 (day low).
- The close (~US $665.67) lands closer to support than resistance – a small red flag for bulls.
📉 Volume
- Volume was not explosively high but solid (~87 m shares).
- When price drops with decent volume, it suggests some sellers were out there – not just lazy market drift.
⏳ Moving Averages / MACD / RSI (high-level)
- MACD (short-term vs long-term) likely flattening or turning bearish given the day’s red close after testing highs.
- RSI for the day probably in the 50–55 range, given the broad range between high & low – suggests neither extreme overbought nor oversold.
- The intraday high near resistance + failure to hold suggests bearish divergence risk (if MACD histogram shrinks, etc.).
🔍 Price Action & Sentiment
- Morning strength: Price opened strong, moved up to ~US $673.7.
- Mid-day shift: Price pulled down to low ~662 – roughly a ~US $11 move from high to low.
- Close: Fell back to ~665.7 – so roughly a retracement of more than half the intraday gain.
- The pattern: “Test resistance → fail → sell-off back to lower zone” = bearish intraday structure.
🧐 Merlion’s Take: Bearish or Bullish?
Sentinel for the day: 🧷 Slightly Bearish
Here’s why:
- SPY failed to close near its intraday high despite initial strength.
- Volume supports that move – meaning it wasn’t just low-volume noise.
- The structure (high → low → lower close) resembles a rejection at the resistance level.
- If tomorrow opens lower or below the support ~662 area, could trigger further downside momentum.
🔮 What to Watch Tomorrow
- If SPY opens above ~670 and holds support above 665, bulls still have a chance.
- If SPY breaks below ~662 early, bears might charge ~650 or lower next.
- Volume spikes on downside = serious trouble for bulls.
- Watch for MACD cross-downs or RSI slipping under 45 as additional confirmation.
🦁 Final Word
Today’s action speaks: bulls tried, but got pushed back. Doesn’t mean crash time, but caution light is blinking. If you’re holding broad-market bets through SPY, maybe tighten stops, check your risk, and don’t assume smooth sailing.
“When the market dances high at the door but closes near the stairs, the curtains might soon fall.”
Stay vigilant. Stay ballin’.
– MERLION$ | MerlionFinance.com
Disclaimer: Not financial advice. Just my personal read. Do your own research.


Leave a comment